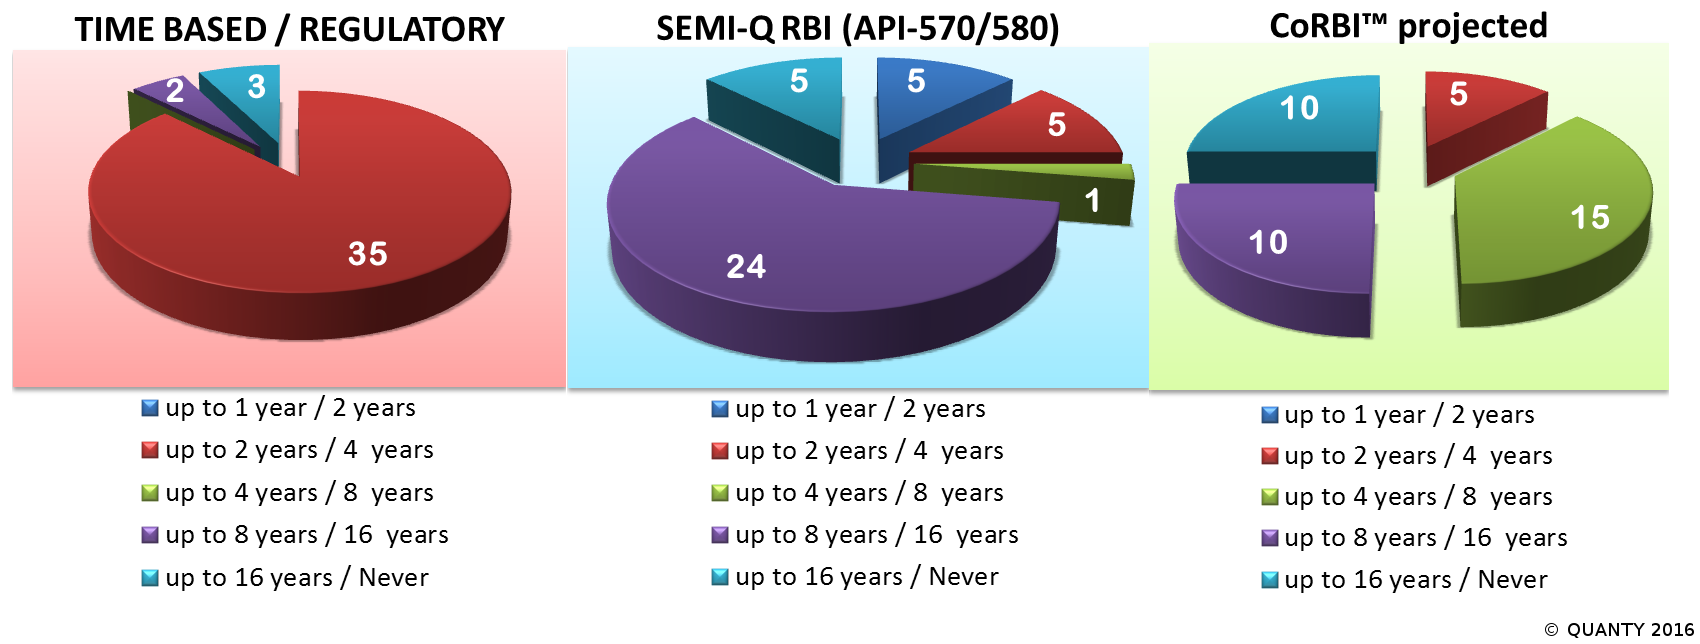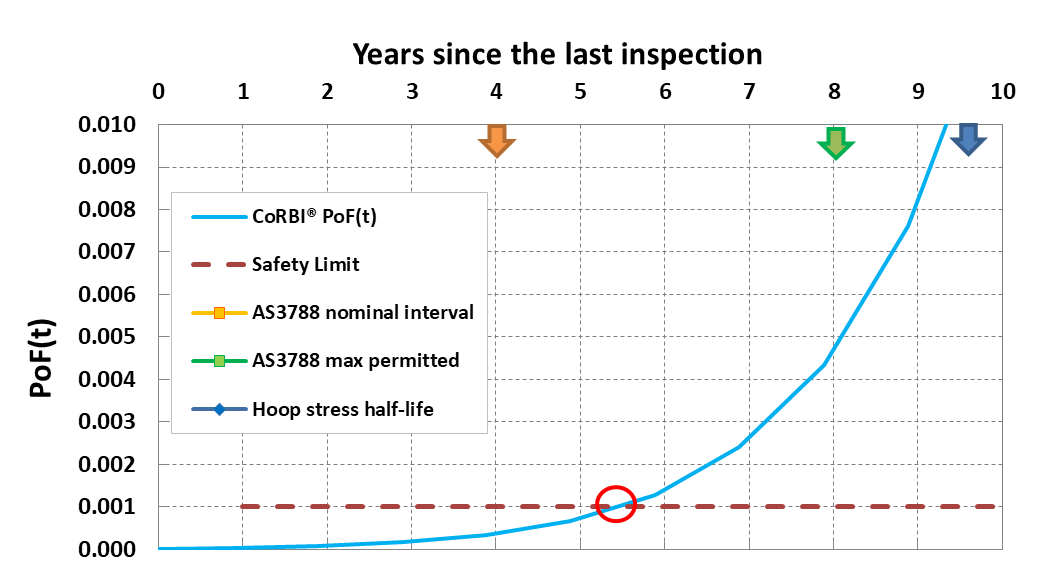
We find Risk Cost in terms of dollars and safety exposure for extra savings and added safety
In Design & Procurement - Look ahead for Operation implications:
- pie_chart Concept designs that meet Asset Management goals
- build Truly manageable integrity and compliance
- access_time Solutions which are fit for service during the whole life
In Operation - Loop Control of Risks:
- verified_user Particular risk controls are adequate to the risk levels
- access_alarm Timing of inspection and maintenance is optimal
- equalizer Depth of risk assessments is failure risk proportional
In Troubleshooting or Life Extension - Assess Costs and Benefits:
- playlist_add_check Mitigation versus Inaction scenarios were studied
- iso All risk control options are evaluated
- flash_on Probability of failure is controlled down to tolerable

