It is known that the 1st fatigue curve was created in XIX century by German engineer August Woehler. He investigated why railroad carriage axles fail in a delayed manner. The Woehler’s phenomenological fatigue model was correct and remains generally valid now. However, there are some additional limitations and improvement ideas, which are necessary for practical vibration fatigue predictions.

Misconceptions first
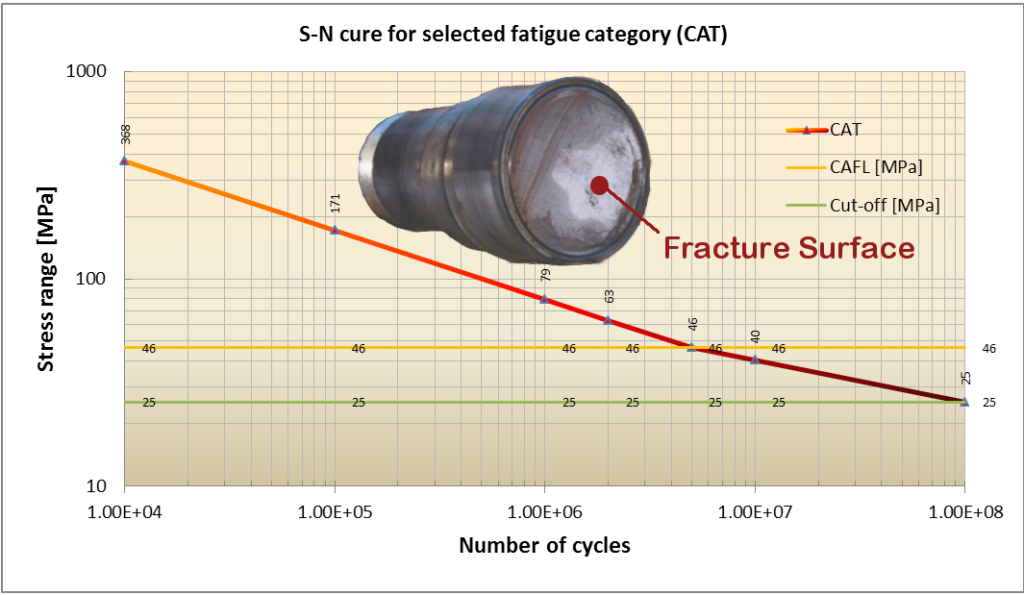
Consider the above graph meaning: The Number of stress cycles to failure (N) is a function of the Stress amplitude in each cycle (S). More stress means less life, as shown by the red line. The yellow line simulates a constant amplitude fatigue limit. Finally, the green line is the variable amplitude stress cut-off, e.g. no fatigue damage is assumed in design for lower stresses.
The historical reason for the cut-offs is that Woehler stopped his testing near 1 000 000 cycles of loading. Because neither XIX century railroad applications, nor testing rigs, could or needed to exert more load cycles within a sensible time. Machines were big and slow those days. So the apparent ‘fatigue limit‘ emerged. It remains the most popular misconception nowadays. As a matter of fact, vibrating components can fail at ‘negligible’ stress levels. The fatigue limit is a design case abstraction, which is not adequate for integrity assessment purposes in most cases. We earlier discussed the design and assessment differences in this post.
Another typical practitioner’s mistake is using a constant stress amplitude (CSA) together with the above fatigue curve. The CSA is something we may only have in a design stage, where it makes sense due to the data scarcity.

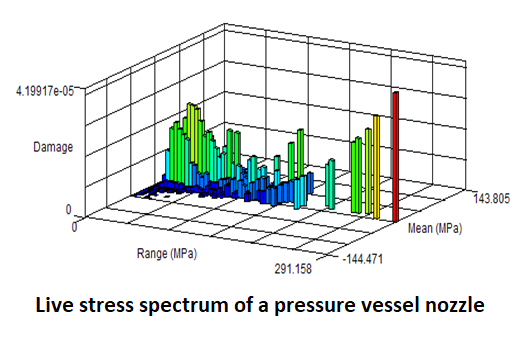
Alas, in a real operation, our equipment experiences a stress spectrum. That very live stress spectrum (achieved from measurements or simulation) is required for realistic fatigue life predictions.
What is the ‘gigacycle’ fatigue?
Vibration fatigue failures are those facts, given us by the Reality to reject the fallacy of an ‘absolute fatigue limit’. Vibration failures do happen due to a large series of very low amplitude random stress cycles. Therefore, a Vibration fatigue damage is characterized by very low stresses acting at high frequencies. The vibration typically occurs at 50Hz to 500Hz, depending on the system’s natural frequencies though. For example, a virtual mechanical part vibrating at 100Hz will experience:
- 100 stress cycles per second
- 360 000 stress cycles per hour (some middle of the log-log scale fatigue curve above)
- 260 000 000 cycles per month. Bingo! We went beyond the curve’s extreme right!
The modern fatigue knowledge distinguishes three fatigue damage modes :
- The number of stress cycles to failure < 10 000 is characteristic to Low-cycle fatigue.
- Failures at between 100 000 and 10 000 000 is a High-cycle fatigue.
- Fracture beyond 100 000 000 is driven by the Giga-cycle fatigue.
The term ‘Gigacycle Fatigue‘ was introduced by Professors Paul Paris and Claude Bathias in early 2000s. If you’ve ever heard about the “Paris law” in fracture mechanics, that was that Prof. Paris who contributed in this book:
Equipment vibration failures (of pipe fittings, car engine mountings, rotating equipment bearings, etc.) can occur by the gigacycle mechanism, which is governed by a micro-crack propagation law. However, it is not that much different to the high cycle fatigue, if we consider the fatigue analysis techniques and requirements. Vibration can result in high-cycle failures as well, providing that the stress levels are relatively high. The fatigue potential simply needs to be predicted numerically.
Brief benefits from vibration fatigue analysis
One very good news about vibration fatigue assessments – they don’t require changing the vibration measurement practices. The state-of-art field vibration measurements already provide most input data required for a remnant life assessment.
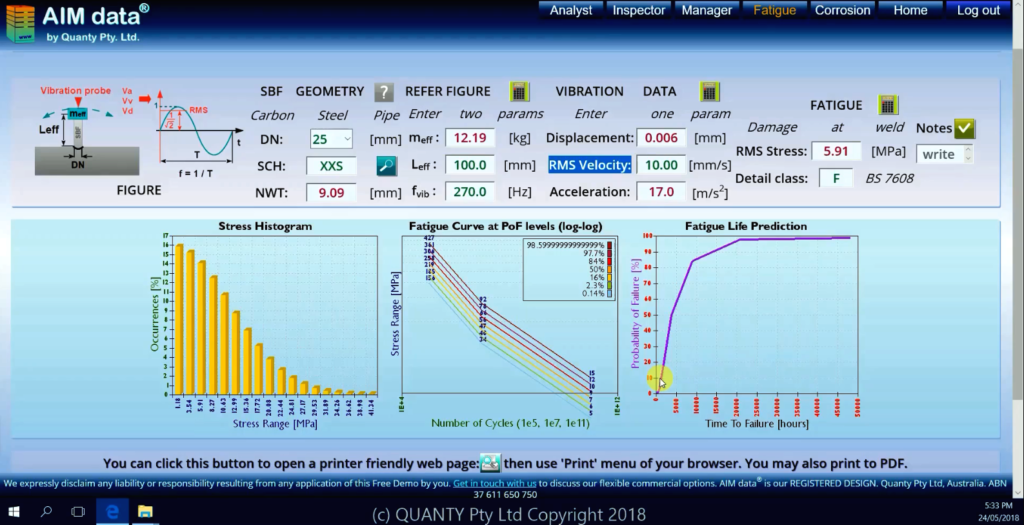
We have automated a typical analysis scheme for a Small Bore Fitting (SBF), and the following screenshot reveals major benefits from this analysis:

Have a look of the right bottom graph – this is the fitting’s Probability of Failure (PoF) versus time, estimated solely from vibration measurements:
- It tells us that our decision making time frame is no longer than 200-500 hours in this case (the x-axis), available to reduce or mitigate failure risks.
- It tells us that there is practically no chance to survive beyond circa 15 000 hours of vibration (that is y-axis, PoF > 90%).
- This not a red/yellow/green qualitative screening (from EI guidelines), this is your justified decision making for risk control and budget allocation
If you are after a cost/benefit analysis – there is no way forward without quantifying the integrity phenomena. Upgrade phenomena to numeric problems in order to get them manageable with confidence.
This vibration assessment method is just one of our solutions for the New Generation Asset Integrity management practice. We currently offer it for a broad range of integrity problems:
- corrosion analysis (RBI)
- probabilistic design support
- condition monitoring data treatment
- and more is coming
These innovations demand knowledge beyond standard practices. How did we manage to create a range of practical and elegant methods already? Namely, we respect the science. Send us some formal lines here to get in touch. We can only help you if you communicate your challenges to us.
P. S. would you like to see an article discussing the fatigue limit and fatigue theory myths in more detail? Maybe some other ideas? Post your suggestions in this article comments.
